
The Shiba Inu (SHIB) price has finally reached the support line of a long-term pattern. The price is in the process of initiating a bounce, but its validity has yet to be confirmed.
If the price were to break down from the triangle, the support structure in place for a year would be rendered invalid. However, a bounce could lead to a considerable increase, possibly taking the price to the triangle’s resistance line.
Shiba Inu Price Finally Bounces at Long-Term Support
Based on the daily analysis, the Shiba Inu coin price has traded inside a symmetrical triangle pattern since June 2022. This pattern is considered neutral. Therefore, the price has an equal chance of either breaking out upwards or breaking downwards.
On May 8, the SHIB price rebounded at the support line of the triangle. Before this, the line had not been reached since the beginning of the year. At the time, a sharp increase followed after the bounce (green icon).
While a bounce did not occur immediately, the SHIB price is in the process of creating a bullish candlestick, which could catalyze an increase toward the triangle’s resistance line.
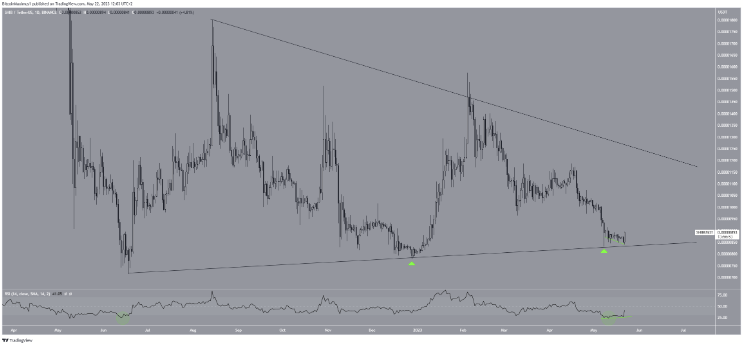
The daily Relative Strength Index (RSI) gives mostly bullish signals. Traders use the RSI to gauge momentum, determine if a market is overbought or oversold, and make decisions about buying or selling.
If the RSI reading is above 50 and the trend is upward, it indicates an advantage for the bulls. Conversely, if the reading is below 50, the opposite is true.
Even though it is below 50, the RSI is currently increasing and has moved outside of its oversold territory. Moreover, it has generated a bullish divergence (green line).
This is a type of occurrence in which a momentum drop does not accompany a price drop. It often leads to significant upward movements.
SHIB Price Prediction: Is the Bounce Valid?
The technical analysis of the short-term six-hour time frame supports the validity of the bounce. The first reason for this is that the price movement since April 16 has been contained inside a descending parallel channel.
These channels are considered corrective patterns, meaning that they lead to breakouts most of the time.
The previously outlined bounce caused a breakout from this channel, a movement that has been confirmed with a close in the six-hour chart. As a result, this suggests that the decrease that began on April 16 is now finished.
Similarly to the daily time frame, the bounce was preceded by a bullish divergence in the RSI (green line). As a result, an increase toward at least the $0.000010 resistance and possibly the triangle’s resistance line at $0.000012 is the most likely scenario.
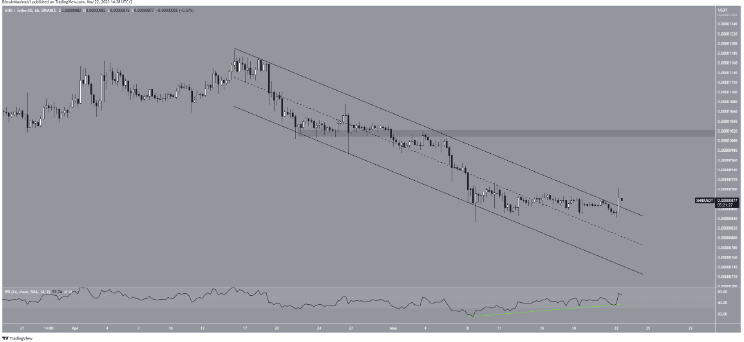
However, a price breakdown below the triangles support line would negate this bullish SHIB price prediction.
In that case, the next drop could take the price to $0.0000057, a level not seen since June 2021.